
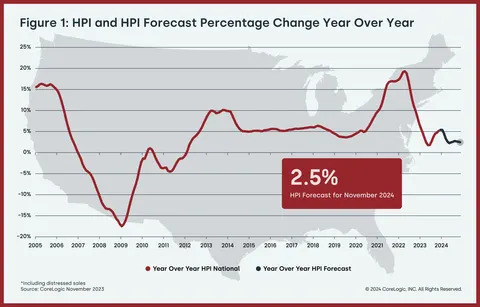
U.S. home prices increased by 5.2% year over year in November, the strongest annual growth rate recorded since January 2023.
Annual home price growth is projected to slow to 2.3% in the spring of 2024 before stabilizing for the rest of the year.
Detroit was the nation’s fastest-appreciating metro area in November at 8.7%, ending Miami’s 16-month run in the top spot.
Northeastern states again posted the nation’s largest price gains, with Rhode Island, Connecticut and New Jersey showing increases that were more than double the national rate.
IRVINE, Calif., January 09, 2024--(BUSINESS WIRE)--CoreLogic®, a leading global property information, analytics and data-enabled solutions provider, today released the CoreLogic Home Price Index (HPI™) and HPI Forecast™ for November 2023.
Annual single-family home price growth moved up again in November, posting a 5.2% gain. Northeastern states continued to show significant appreciation, with Rhode Island (11.6%), Connecticut (10.6%), and New Jersey (10.5%) all seeing double-digit growth. In addition, 24 other states posted higher year-over-year home price gains than the national rate.
Areas in the Northeast, South and Midwest — where relative affordability continues to drive demand — posted the strongest home price increases. Many of the nation’s current fastest-appreciating real estate markets lagged in price growth during the pandemic but have recently benefited from job gains, with The Inflation Reduction Act and the CHIPs Act helping to spur housing demand.
"Home price appreciation continued to push forward in November, despite the new highs in mortgage rates seen over the year," said Dr. Selma Hepp, chief economist for CoreLogic. "And while the annual growth reflects comparison with last year's declines, seasonal gains remain in line with historical averages. However, in some metro areas, such as those in the Mountain West and the Northwest, higher interest rates are having a greater impact on homebuyers’ budgets, which is contributing to a larger seasonal slump."
"This continued strength remains remarkable amid the nation’s affordability crunch but speaks to the pent-up demand that is driving home prices higher," Hepp continued. "Markets where the prolonged inventory shortage has been exacerbated by the lack of new homes for sale recorded notable price gains over the course of 2023."
Top Takeaways:
U.S. single-family home prices (including distressed sales) increased by 5.2% year over year in November 2023 compared with November 2022. On a month-over-month basis, home prices rose by 0.2% compared with October 2023.
In November, the annual appreciation of detached properties (5.4%) was 1 percentage point higher than that of attached properties (4.4%).
CoreLogic’s forecast shows annual U.S. home price gains slowing to 2.5% in November 2024.
Detroit posted the highest year-over-year home price increase of the country's 20 tracked metro areas in November, at 8.7%. Miami saw the next-highest gain (8.3%), followed by Charlotte, North Carolina (7.4%).
Among states, Rhode Island ranked first for annual appreciation in November (up by 11.6%), followed by Connecticut (up by 10.6%) and New Jersey (up by 10.5%). Idaho (-1.3%), Utah (-0.4%) and Washington, D.C. (-0.2%) recorded year-over-year home price losses.
The next CoreLogic HPI press release, featuring December 2023 data, is scheduled to be issued on February 6, 2024, at 8 a.m. EST.
Methodology
The CoreLogic HPI™ is built on industry-leading public record, servicing and securities real-estate databases and incorporates more than 45 years of repeat-sales transactions for analyzing home price trends. Generally released on the first Tuesday of each month with an average five-week lag, the CoreLogic HPI is designed to provide an early indication of home price trends by market segment and for the Single-Family Combined tier, representing the most comprehensive set of properties, including all sales for single-family attached and single-family detached properties. The indices are fully revised with each release and employ techniques to signal turning points sooner. The CoreLogic HPI provides measures for multiple market segments, referred to as tiers, based on property type, price, time between sales, loan type (conforming vs. non-conforming) and distressed sales. Broad national coverage is available from the national level down to ZIP Code, including non-disclosure states.
CoreLogic HPI Forecasts™ are based on a two-stage, error-correction econometric model that combines the equilibrium home price—as a function of real disposable income per capita—with short-run fluctuations caused by market momentum, mean-reversion, and exogenous economic shocks like changes in the unemployment rate. With a 30-year forecast horizon, CoreLogic HPI Forecasts project CoreLogic HPI levels for two tiers — Single-Family Combined (both attached and detached) and Single-Family Combined Excluding Distressed Sales. As a companion to the CoreLogic HPI Forecasts, Stress-Testing Scenarios align with Comprehensive Capital Analysis and Review (CCAR) national scenarios to project five years of home prices under baseline, adverse and severely adverse scenarios at state, metropolitan areas and ZIP Code levels. The forecast accuracy represents a 95% statistical confidence interval with a +/- 2% margin of error for the index.
About Market Risk Indicators
Market Risk Indicators are a subscription-based analytics solution that provide monthly updates on the overall health of housing markets across the country. CoreLogic data scientists combine world-class analytics with detailed economic and housing data to help determine the likelihood of a housing bubble burst in 392 major metros and all 50 states. Market Risk Indicators is a multi-phase regression model that provides a probability score (from 1 to 100) on the likelihood of two scenarios per metro: a >10% price reduction and a ≤ 10% price reduction. The higher the score, the higher the risk of a price reduction.
About the Market Condition Indicators
As part of the CoreLogic HPI and HPI Forecasts offerings, Market Condition Indicators are available for all metropolitan areas and identify individual markets as overvalued, at value or undervalued. These indicators are derived from the long-term fundamental values, which are a function of real disposable income per capita. Markets are labeled as overvalued if the current home price indexes exceed their long-term values by greater than 10% and undervalued where the long-term values exceed the index levels by greater than 10%.
#humanitiesinrealestate
Source: CoreLogic