
Foreclosure Starts Up from 2022, While Foreclosure Completions Decline; December 2023 Foreclosure Activity Declines from Previous Month; Q4 2023 Foreclosure Activity Declines from Previous Quarter
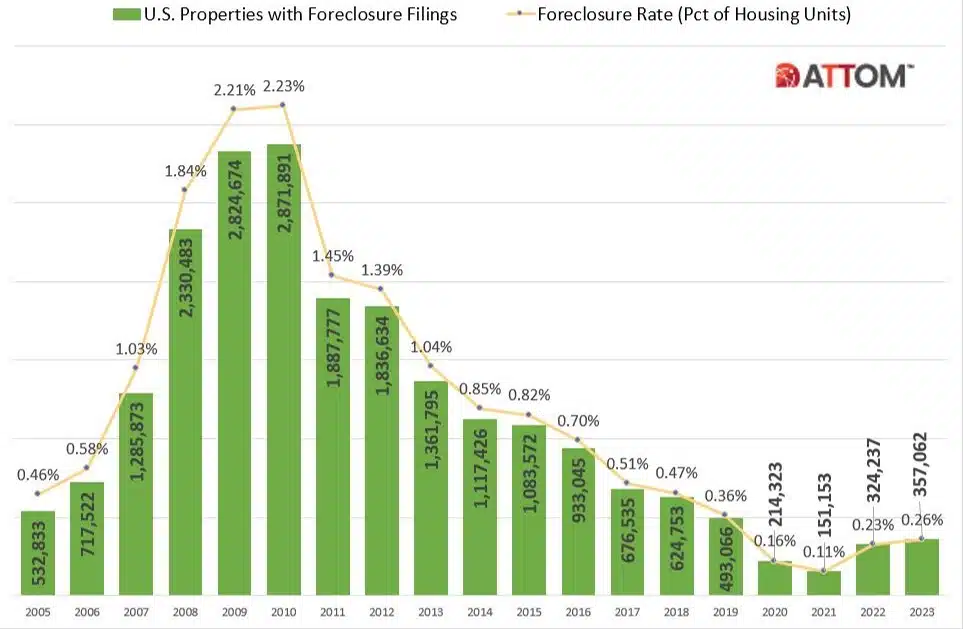
IRVINE, Calif. – Jan. 11, 2024 — ATTOM, a leading curator of land, property, and real estate data, today released its Year-End 2023 U.S. Foreclosure Market Report, which shows foreclosure filings— default notices, scheduled auctions and bank repossessions — were reported on 357,062 U.S. properties in 2023, up 10 percent from 2022 and up 136 percent from 2021 but down 28 percent from 2019, before the pandemic shook up the market. Foreclosure filings in 2023 were also down 88 percent from a peak of nearly 2.9 million in 2010.
“Reflecting on 2023, we see the recent rise in foreclosure activity as a market correction rather than a cause for alarm. It signals a return to more traditional patterns after years of volatility,” said Rob Barber, CEO at ATTOM. “Our data suggests that while foreclosure activity may fluctuate, it’s unlikely to approach the highs seen in the last decade. Instead, we foresee a market that is more reflective of broader economic trends, with foreclosure filings becoming a more predictable aspect of the housing landscape. This shift offers a silver lining — the opportunity for investors, homeowners, and industry professionals to plan and strategize with greater confidence and insight.”

ATTOM’s year-end foreclosure report provides a unique count of properties with a foreclosure filing during the year based on publicly recorded and published foreclosure filings collected in more than 3,000 counties nationwide, accounting for more than 99 percent of the U.S. population – also available for licensing or customized reporting. See full methodology below.
The report also includes new data for December 2023, showing there were 30,314 U.S. properties with foreclosure filings, down 6 percent from the previous month and down 2 percent from a year ago.
Foreclosure starts on the rise nationwide
Lenders started the foreclosure process on 270,222 U.S. properties in 2023, up 9 percent from 2022, up 193 percent from 2021, but down 20 percent form 2019 and down 87 percent from a peak of 2,139,005 in 2009.
States that saw the greatest number of foreclosure starts in 2023 included California (29,180 foreclosure starts); Texas (28,533 foreclosure starts); Florida (27,427 foreclosure starts); New York (17,330 foreclosure starts); and Illinois (13,764 foreclosure starts).
Counter to the national trend, 6 states saw an increase in foreclosure starts from 2019. They included Indiana (up 73 percent); Idaho (up 70 percent); Michigan (up 15 percent); Nevada (up 10 percent); and Minnesota (up 9 percent).
Those metropolitan statistical areas with a population greater than 1 million that saw the greatest number of foreclosure starts in 2023, included New York, New York (18,464 foreclosure starts); Chicago, Illinois (11,620 foreclosure starts); Houston, Texas (9,476 foreclosure starts); Los Angeles, California (8,835 foreclosure starts); and Philadelphia, Pennsylvania (8,224 foreclosure starts).
Bank repossessions decline slightly from 2022
Lenders repossessed 42,090 properties through foreclosures (REO) in 2023, down 2 percent from 2022 but down 71 percent from 2019 (143,955) and down 96 percent from a peak of 1,050,500 in 2010.
States that saw the greatest number of REOs in 2023 included Illinois (3,814 REOs); Michigan (3,634 REOs); Pennsylvania (2,853 REOs); California (2,633 REOs); and New York (2,538 REOs).
Those metropolitan statistical areas with a population greater than 1 million that saw the greatest number of REOs in 2023 included Chicago, Illinois (2,505 REOs); New York, New York (2,045 REOs); Detroit, Illinois (1,795 REOs); Philadelphia, Pennsylvania (1,130 REOs); and Baltimore, Maryland (872 REOs).
New Jersey, Illinois, and Delaware post highest state foreclosure rates in 2023
States with the highest foreclosure rates in 2023 were New Jersey (0.46 percent of housing units with a foreclosure filing); Illinois (0.42 percent); Delaware (0.41 percent); Maryland (0.40 percent); and Ohio (0.38 percent).
Rounding out the top 10 states with the highest foreclosure rates in 2023, were South Carolina (0.38 percent); Nevada (0.37 percent); Florida (0.37 percent); Connecticut (0.35 percent); and Indiana (0.32 percent).
Cleveland, Atlantic City, and Lakeland post highest metro foreclosure rates in 2023
Among 223 metropolitan statistical areas with a population of at least 200,000, those with the highest foreclosure rates in 2023 were Cleveland, Ohio (0.62 percent of housing units with a foreclosure filing); Atlantic City, New Jersey (0.62 percent); Lakeland, Florida (0.56 percent); Columbia, South Carolina (0.55 percent); and Fayetteville, North Carolina (0.51 percent).
Metro areas with a population greater than 1 million, including Cleveland, Ohio that had the highest foreclosure rates in 2023 were: Philadelphia, Pennsylvania (0.48 percent); Jacksonville, Florida (0.47 percent); Las Vegas, Nevada (0.46 percent); and Chicago, Illinois (0.45 percent).
Average time to foreclose decreases quarterly and annually
U.S. properties foreclosed in the fourth quarter of 2023 had been in the foreclosure process an average of 720 days, a 7 percent decrease from the previous quarter and 16 percent decrease from a year ago.
2023 Year-End Avg Days to Complete Foreclosure

States with the longest average time to foreclose in Q4 2023 were Louisiana (2,641 days); Hawaii (2,031 days); New York (2,006 days); Nevada (1,816 days); and Kentucky (1,643 days).
Q4 2023 Foreclosure Activity High-Level Takeaways
- There was a total of 92,896 U.S. properties with foreclosure filings in Q4 2023, down 8 percent from the previous quarter but up 2 percent from a year ago.
- Nationwide in Q4 2023, one in every 1,503 properties had a foreclosure filing.
- States with the highest foreclosure rates in Q4 2023 were Delaware (one in every 903 housing units with a foreclosure filing); New Jersey (one in every 914 housing units); Ohio (one in every 922 housing units); Maryland (one in every 943 housing units); and South Carolina (one in every 995 housing units).
December 2023 Foreclosure Activity High-Level Takeaways
- Nationwide in December 2023, one in every 4,606 properties had a foreclosure filing.
- States with the highest foreclosure rates in December 2023 were Maryland (one in every 2,570 housing units with a foreclosure filing); Connecticut (one in every 2,660 housing units); New Jersey (one in every 2,775 housing units); Ohio (one in every 2,819 housing units); and Delaware (one in every 2,967 housing units).
- 20,490 U.S. properties started the foreclosure process in December 2023, down 8 percent from the previous month and down 3 percent from a year ago.
- Lenders completed the foreclosure process on 3,503 U.S. properties in December 2023, up 37 percent from the previous month but down 4 percent from a year ago.
Report methodology
The ATTOM U.S. Foreclosure Market Report provides a count of the total number of properties with at least one foreclosure filing entered into the ATTOM Data Warehouse during the month and quarter. Some foreclosure filing entered into the database during the quarter may have been recorded in the previous quarter. Data is collected from more than 3,000 counties nationwide, and those counties account for more than 99 percent of the U.S. population. ATTOM’s report incorporates documents filed in all three phases of foreclosure: Default — Notice of Default (NOD) and Lis Pendens (LIS); Auction — Notice of Trustee Sale and Notice of Foreclosure Sale (NTS and NFS); and Real Estate Owned, or REO properties (that have been foreclosed on and repurchased by a bank). For the annual, midyear and quarterly reports, if more than one type of foreclosure document is received for a property during the timeframe, only the most recent filing is counted in the report. The annual, midyear, quarterly and monthly reports all check if the same type of document was filed against a property previously. If so, and if that previous filing occurred within the estimated foreclosure timeframe for the state where the property is located, the report does not count the property in the current year, quarter or month.
#humanitiesinrealestate
Source: attomdata