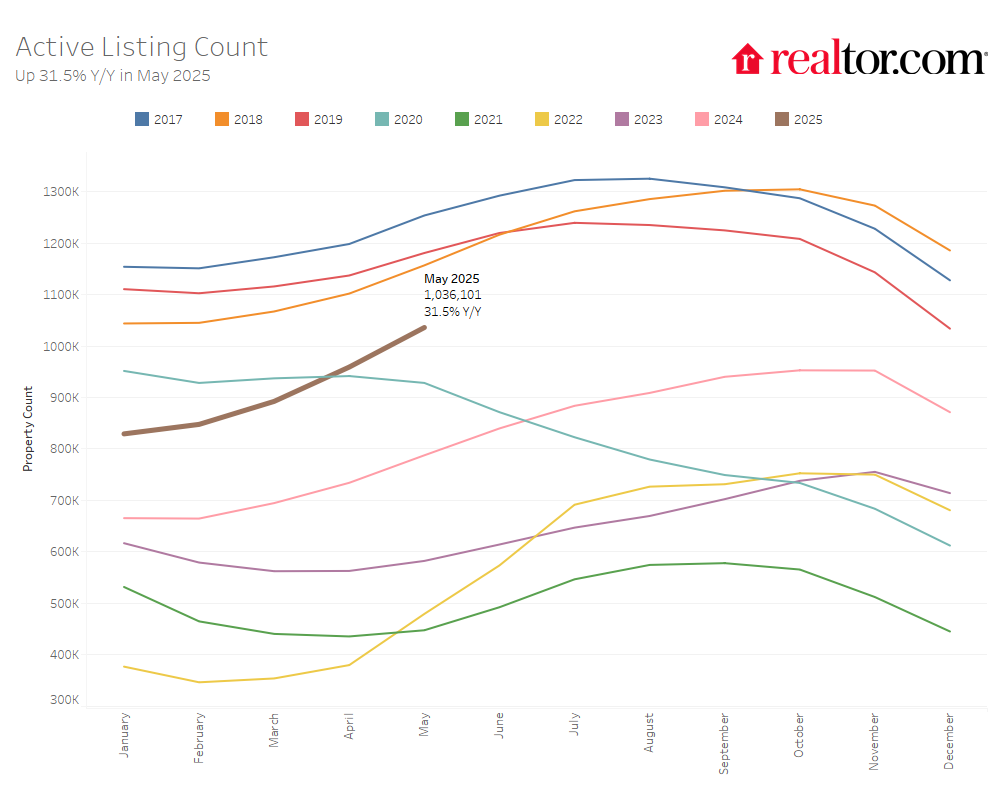
If it feels like you've been noticing more for sale signs popping up, it's not all in your head: Housing inventory across the nation has consistently been increasing across the country, including right here in New Jersey.
With more than 1.5 million homes for sale — 31.5% more than the year prior — May marked the 19th consecutive month of inventory growth across the nation, according to Realtor.com's Monthly Housing Market Trends Report. Inventory is at its highest post-pandemic level to date, and this marks the first time the number of homes for sale has topped one million since the winter of 2019.
"Still, inventory remains 14.4% below typical 2017-2019 levels, though May's gains indicate the market is closing the gap at an accelerating pace," Realtor.com said.
The national median listing price was $440,000, or about 0.1% more than this time last year, but Realtor.com found that about 19.1% of active listings saw price reductions. This is the highest share for any May since at least 2016, and the fifth consecutive month with growing price reductions nationwide.
In New Jersey, there were a total of 16,379 active home listings. This was 24.11% more than last year and 15.69% more than April 2025, according to Realtor.com's monthly market data.

May marked the 19th consecutive month of inventory growth across the nation. Inventory is at its highest post-pandemic level to date, the number of active listings exceeded one million for the first time since the winter of 2019.
The Garden State also had a median listing price of $575,000 — a 0.86% decrease from last year and a 1.05% increase from April 2025 — and active listings stayed on the market for about 33 days.
Mortgage rates also remained fairly consistent in May with what we've seen over the last several months. Rates for a 30-year fixed mortgage ranged from 6.76% to 6.89%, and rates for a 15-year fixed mortgage ranged from 5.89% to 6.03%, Freddie Mac reported.
Here's a breakdown of how North Jersey's real estate market performed in May 2024, according to data from Realtor.com:
How much has North Jersey's housing inventory changed?
Fourteen of New Jersey's 21 counties had an increase in new listings compared with May 2024, and 12 counties had an increase in new listings compared with April 2025.
In North Jersey, all six counties had an increase in new listings compared to this time last year.
- Bergen: 1,016 listings (14.16%)
- Passaic: 336 listings (1.2%)
- Morris: 624 listings (14.29%
- Essex: 556 listings (11.2%)
- Sussex: 264 listings (6.45%)
- Hudson: 484 listings (0.83%)

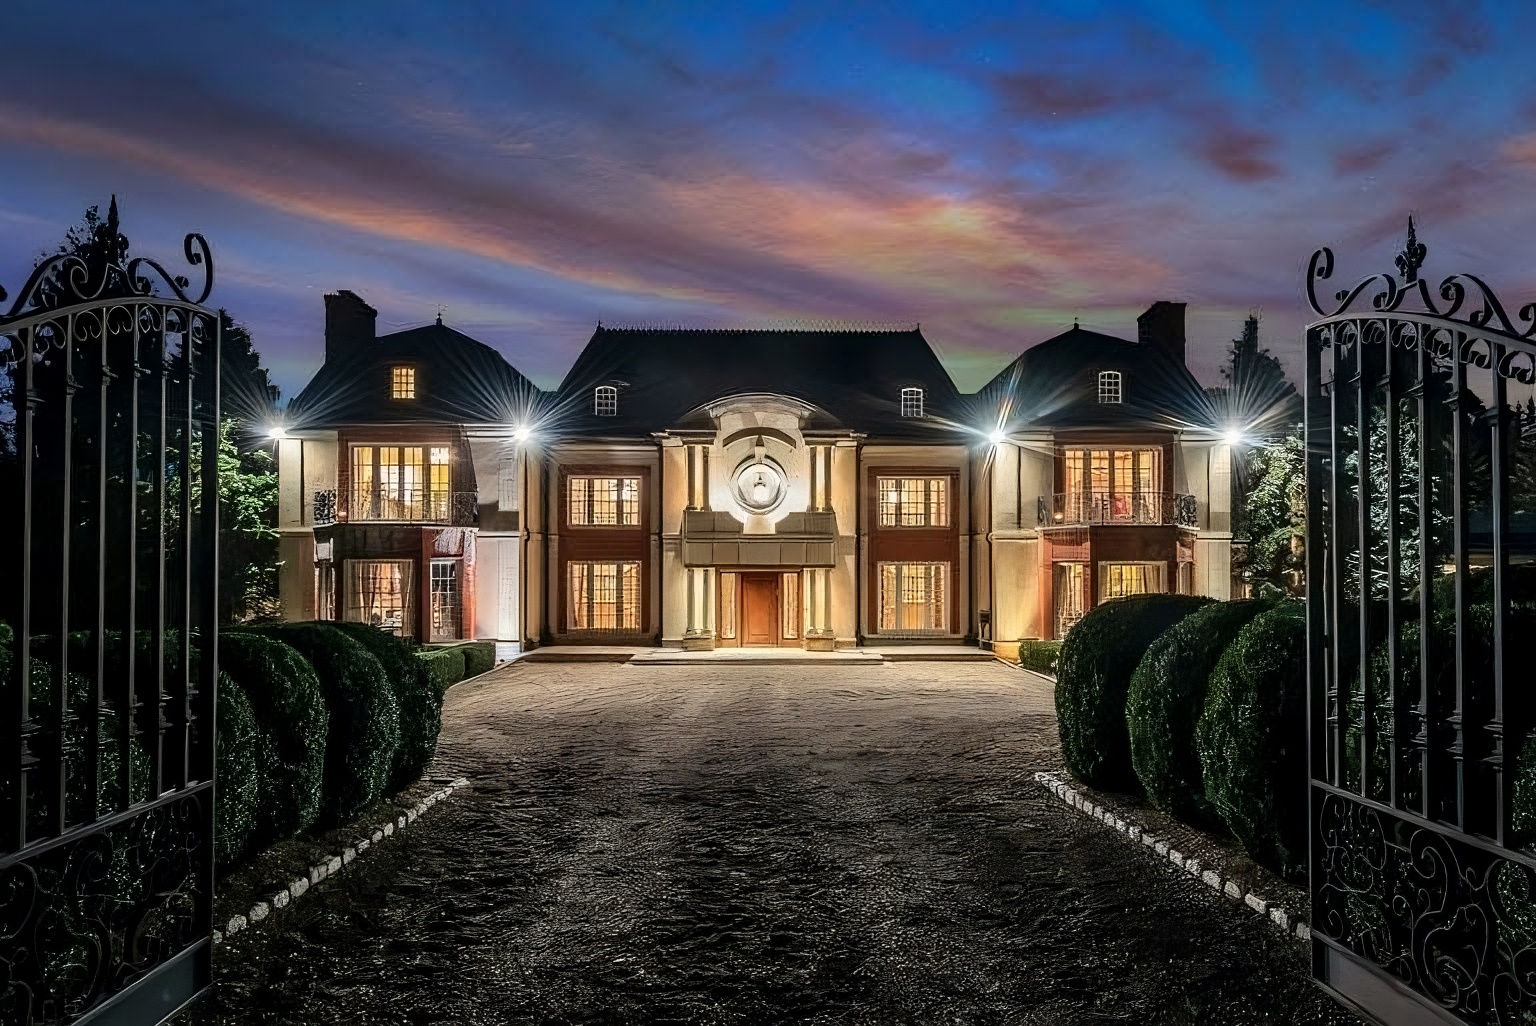
The home at 120 S. Woodland St. in Englewood sold for $6 million on May 15. It was the overall priciest property to sell in North Jersey in May.
When compared with April, Essex and Sussex were the only two North Jersey counties that saw a decline in new home listings. Otherwise, all other North Jersey counties saw increases during this time.
- Bergen: 21.53%
- Passaic: 9.09%
- Morris: 15.56%
- Essex: -1.42%
- Sussex: -2.94%
- Hudson: 0.41%
How long are North Jersey homes staying on the market?
Of New Jersey's 21 counties, 16 had active listings stay on the market for a longer period compared with May 2024. And 13 New Jersey counties had active listings stay on the market for a longer period compared with April 2025.
At 31 days — or 7.46% less time than at the same time last year — Sussex was the only North Jersey county that had active listings stay on the market for fewer days in May. All other counties had active listings stay on the market for more days during this time.
- Bergen: 24 days (2.13%)
- Passaic: 23 days (12.2%)
- Morris: 23 days (27.78%)
- Essex: 30 days (13.21%)
- Hudson: 37 days (11.28%)
When compared with the previous month, active listings stayed on the market for more days in the counties of Morris, Essex and Hudson. And the counties of Bergen, Passaic and Sussex had active listings stay on the market for the same amount of time as the month before.
- Bergen: 0%
- Passaic: 0%
- Morris: 21.05%
- Essex: 3.45%
- Sussex: 0%
- Hudson: 17.46%
How much were median home prices in North Jersey?
As usual, median listing prices have continued to rise across most of the state. Sixteen New Jersey counties saw price increases compared to May 2024, while 17 counties saw price increases compared to April 2025.
With a median listing price of $619,000 — down 7.95% compared with the same time last year — Hudson County was the only place in North Jersey that saw median listing prices decrease. All other North Jersey counties saw increases.
- Bergen: $800,000 (0.06%)
- Passaic: $549,999 (10.12%)
- Morris: $749,000 (0.58%)
- Essex: $599,900 (2.42%)
- Sussex: $434,900 (7.39%)
And Hudson was also the only North Jersey county that saw median listing prices decrease when compared with the previous month, at 2.13%. The other five North Jersey counties all saw increases.
- Bergen: 0.13%
- Passaic: 7.58%
- Morris: 3.56%
- Essex: 0.91%
- Sussex: 7.12%
Here's how all 21 New Jersey counties performed in May, according to Realtor.com:
May 2025 market data, by county
| County | New listings | Percent change in new listings (from May 2024) | Median listing price | Percent change in median listing price (from May 2024) | Median days on the market |
| Atlantic County | 444 | 28.32% | $429,900 | 8.29% | 54 |
| Bergen County | 1,016 | 14.16% | $800,000 | 0.06% | 24 |
| Burlington County | 608 | -1.94% | $415,000 | 3.89% | 26 |
| Camden County | 640 | -0.31% | $350,000 | 5.26% | 23 |
| Cape May County | 292 | -0.68% | $869,000 | -9.05% | 59 |
| Cumberland County | 144 | 18.03% | $304,888 | 7.45% | 47 |
| Essex County | 556 | 11.20% | $599,900 | 2.42% | 30 |
| Gloucester County | 400 | 12.36% | $399,000 | 3% | 28 |
| Hudson County | 484 | 0.83% | $619,000 | -7.95% | 37 |
| Hunterdon County | 176 | -12.87% | $699,000 | 0.95% | 26 |
| Mercer County | 396 | 1.02% | $477,000 | 5.24% | 32 |
| Middlesex County | 708 | -3.01% | $557,900 | 2.47% | 26 |
| Monmouth County | 800 | -1.48% | $859,000 | 2.94% | 39 |
| Morris County | 624 | 14.29% | $749,000 | 0.58% | 23 |
| Ocean County | 1,112 | 7.13% | $564,900 | -5.37% | 41 |
| Passaic County | 336 | 1.20% | $549,999 | 10.12% | 23 |
| Salem County | 92 | 24.32% | $299,900 | -1.67% | 45 |
| Somerset County | 396 | 8.79% | $699,999 | -2.78% | 24 |
| Sussex County | 264 | 6.45% | $434,900 | 7.39% | 31 |
| Union County | 472 | 29.67% | $625,000 | 4.34% | 26 |
| Warren County | 182 | -8.57% | $424,998 | 9.82% | 36 |
Maddie McGay is the real estate reporter for NorthJersey.com and The Record, covering all things worth celebrating about living in North Jersey. Find her on Instagram @maddiemcgay, on X @maddiemcgayy, and sign up for her North Jersey Living newsletter. Do you have a tip, trend or terrific house she should know about? Email her at MMcGay@gannett.com.
This article originally appeared on NorthJersey.com: NJ real estate: How market performed in May 2025
Source: www.yahoo.com
#humanitiesinrealestate

